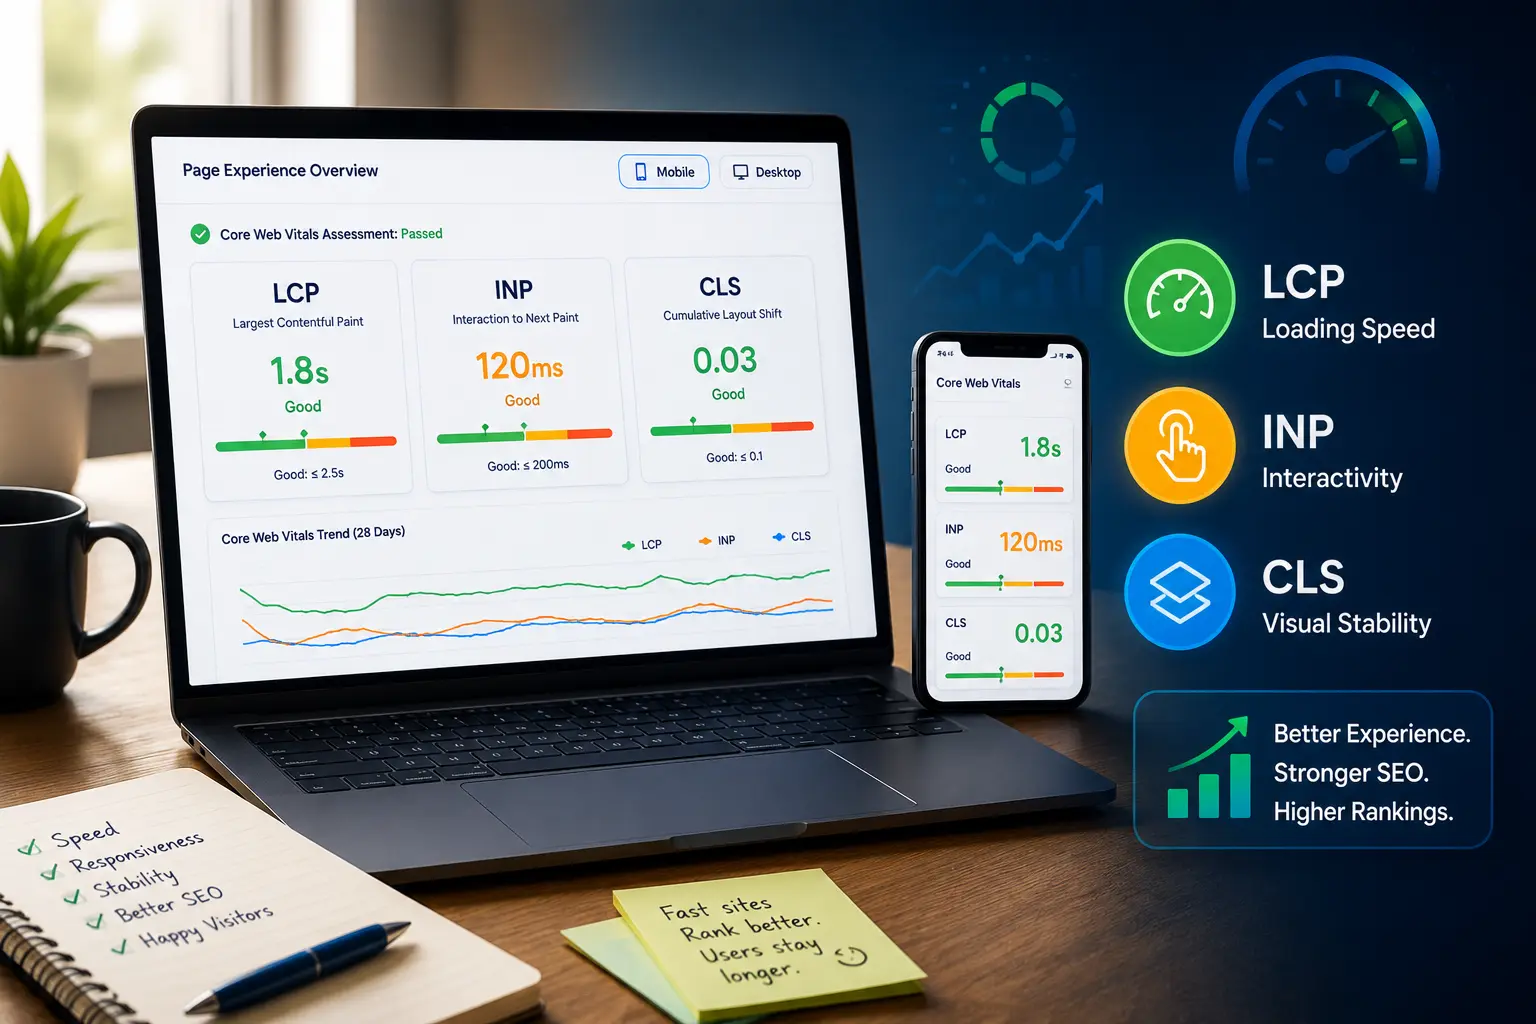
Core Web Vitals are three user experience metrics introduced by Google to measure how quickly, smoothly, and reliably web pages perform: Largest Contentful Paint (LCP), Interaction to Next Paint (INP), and Cumulative Layout Shift (CLS). Core Web Vitals are based primarily on real-world Chrome User Experience Report (CrUX) data rather than laboratory tests. You can check your scores at any time using Google's PageSpeed Insights tool.
I've spent more hours staring at Core Web Vitals scores than I'd like to admit. The red numbers. The yellow warnings. The green indicators that turn yellow again after you thought you'd fixed everything. You make one change. The score improves. You make another change. It gets worse. You undo the second change. It doesn't go back to where it was. Performance work feels like that sometimes.
It's one of those SEO topics that sits at the intersection of technical and practical. Developers care about it because it involves code. SEOs care about it because Google says it matters. Site owners care about it because slow sites lose visitors. Everyone has a stake. Nobody wants to be the one responsible for fixing it.
Core Web Vitals sound more complicated than they are. The concepts are simple. The fixes can be technical. But understanding what Google is measuring and why is the first step toward actually improving your scores.
What Are Core Web Vitals
Core Web Vitals are three specific metrics Google uses to measure how users experience your web pages. They're part of Google's broader Page Experience signals, alongside mobile-friendliness, HTTPS security, and the absence of intrusive interstitials.
Core Web Vitals are measured for individual pages, although Search Console groups similar URLs together in its reports. CrUX collects anonymized performance data from millions of Chrome users to generate these scores. Not every page has enough traffic for field data to appear, but for pages that do, the data reflects real experiences on real devices.
Here's a quick overview of the three metrics:
| MetricMeasuresGood ScoreNeeds ImprovementPoor | ||||
| LCP | Loading speed | ≤ 2.5 seconds | 2.5 to 4.0 seconds | > 4.0 seconds |
| INP | Responsiveness | ≤ 200 milliseconds | 200 to 500 ms | > 500 ms |
| CLS | Visual stability | ≤ 0.1 | 0.1 to 0.25 | > 0.25 |
The acronyms aren't exactly memorable. Nobody remembers what they stand for without looking them up. But the concepts make sense once you understand what they're measuring.
LCP measures loading. How fast does the main content on your page appear? If someone visits your page and stares at a blank white screen for five seconds, your LCP is bad. It doesn't matter how pretty the page is once it loads if half your visitors already left.
INP measures responsiveness. How fast does the page respond when someone clicks or taps something? If someone clicks a button and nothing happens for half a second, your INP is bad. INP replaced an older metric called First Input Delay (FID) in March 2024. FID only measured the first interaction. INP measures all of them. It's a harder test.
CLS measures visual stability. Does the page jump around while it's loading? If someone goes to tap a button and the page shifts and they tap the wrong thing, your CLS is bad. Everyone has experienced this. You're reading an article. An ad loads. The text jumps. You lose your place. It's infuriating.
Each metric gets scored as Good, Needs Improvement, or Poor. Google publishes the thresholds. They occasionally update the metrics themselves, as they did when INP replaced FID. The current thresholds are in Google's documentation and in Search Console's Core Web Vitals report.
Our technical SEO checklist covers Core Web Vitals alongside other technical priorities.
Lab Data vs Field Data
This causes enormous confusion. Let me clear it up.
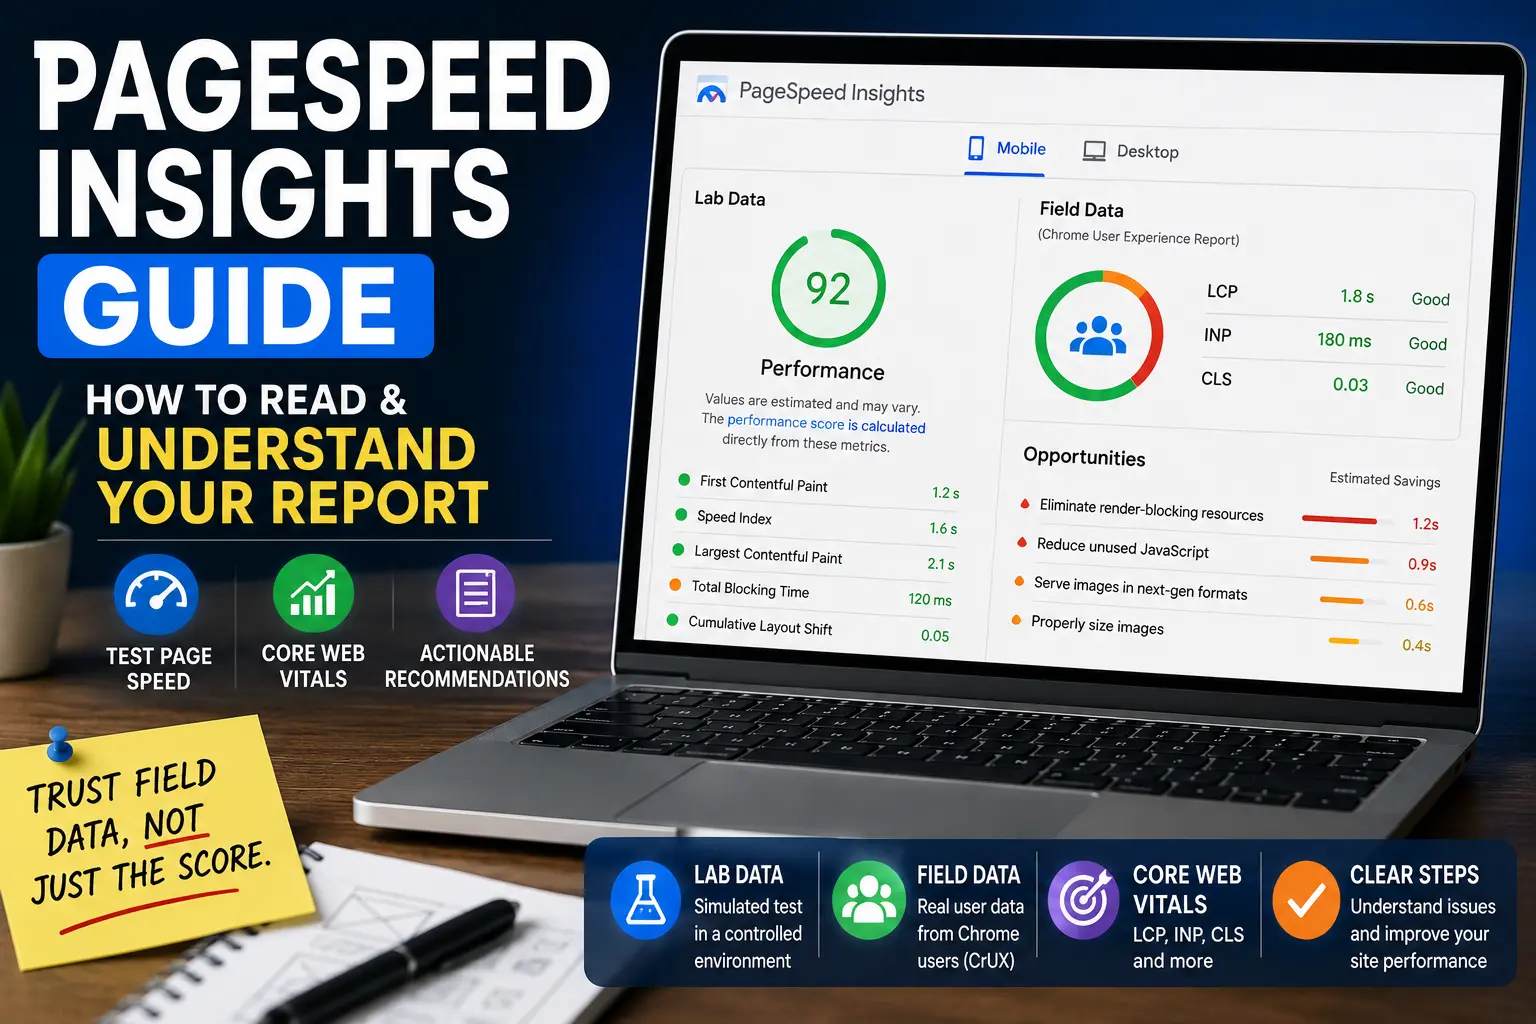
When you run a test in PageSpeed Insights, you often see two sets of numbers. They might disagree. One says your LCP is green. The other says it's yellow. Which one do you trust?
The lab data comes from a simulated test. Google loads your page in a controlled environment with a specific device and network speed. It's consistent. It's repeatable. It's useful for debugging because you can make a change and immediately see the impact.
The field data comes from real Chrome users. People who actually visited your site. On their actual devices. With their actual network connections. It's aggregated over the previous 28 days. It shows what real users experienced, not what a simulation predicted.
If the two disagree, trust the field data. That's what Google uses for Core Web Vitals evaluation. If your field data says your LCP is green, it's green. The lab data is diagnostic information. It helps you understand why the field data is what it is. But the field data is the source of truth.
This also means that if you fix something today, you won't see the improvement in field data for up to 28 days. The field data is a rolling average. Old data has to age out. Lab data responds immediately. Field data takes time.
I've watched site owners make performance improvements and then panic because their Search Console report didn't change. The fix worked. The field data just hasn't caught up yet. Wait a month. Then check.
Core Web Vitals in Google Search Console
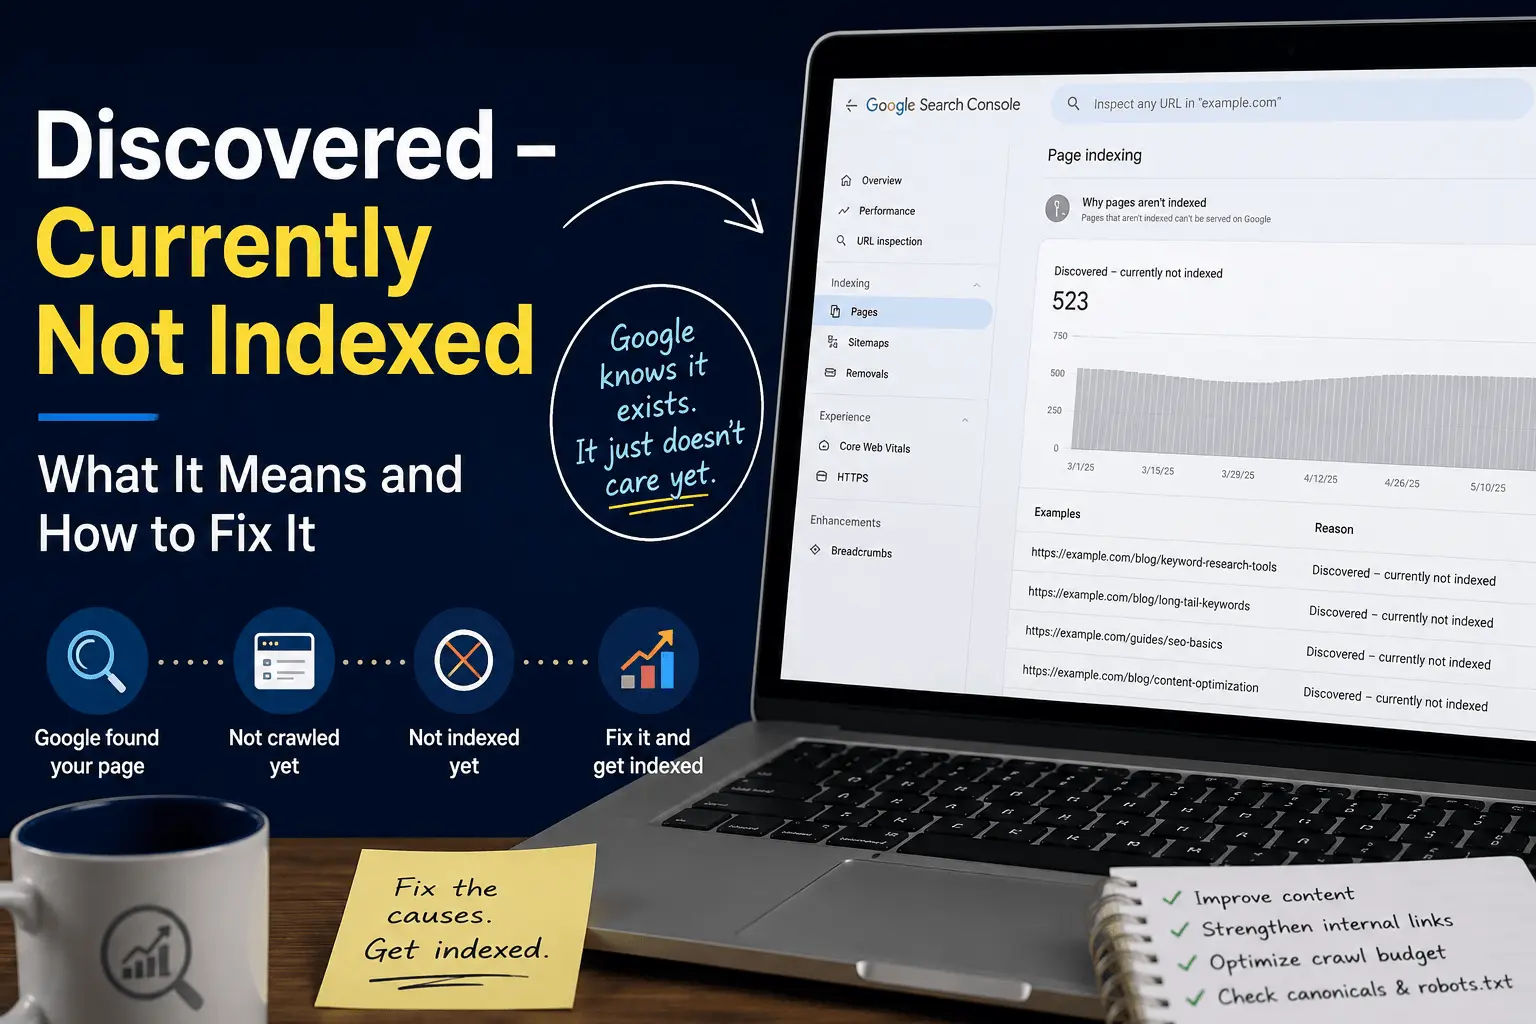
Search Console has a dedicated Core Web Vitals report under the Experience section. It shows how your pages perform across desktop and mobile using field data from real Chrome users.
The report groups URLs by status: Good, Needs Improvement, or Poor. You don't see individual page scores. You see groups of similar pages that share the same issue. This is intentional. Google wants you to fix the underlying template or performance problem, not chase individual URLs.
The report updates slowly because it uses a 28-day rolling window of CrUX data. If you fix something today, it can take up to a month for the report to fully reflect the improvement. This is the most common source of frustration. The fix is deployed. The lab data looks great. Search Console still shows yellow. The old data hasn't aged out yet. Wait. It will.
There are separate reports for Mobile and Desktop. Mobile is almost always worse. Slower devices. Slower connections. More constraints. Google uses mobile scores for page experience evaluation, so prioritize fixing mobile issues first. Since Google primarily evaluates pages using mobile-first indexing, improving mobile performance usually has the biggest impact.
When you fix a group of pages, you can click "Validate Fix" in Search Console. Google monitors the affected pages over the following days and confirms whether the issue is resolved. Validation usually takes a few days to a few weeks depending on how quickly Google recrawls your pages.
Do Core Web Vitals Affect SEO Rankings?
I get this question constantly. The answer is more nuanced than yes or no.
Core Web Vitals are a ranking signal. Google has confirmed this. But they're not a direct ranking factor in the way most people think. They're one of hundreds of signals. Content quality, relevance, and backlinks carry far more weight. A page with perfect Core Web Vitals won't outrank a page with better content and stronger authority.
What Core Web Vitals do is support the page experience signal. Pages that provide a better user experience may receive a slight ranking benefit compared to equivalent pages that provide a poor experience. The key word is equivalent. When content and authority are roughly equal, Core Web Vitals can be the tiebreaker.
But the benefit is small. I've never seen a site jump from page three to page one because they fixed their Core Web Vitals. Content quality. Backlinks. Search intent alignment. These move the needle much more. Core Web Vitals are the tiebreaker, not the game changer.
What Core Web Vitals actually improve is user experience metrics. Bounce rate. Time on site. Pages per session. Conversion rate. These aren't direct ranking factors. But they're business metrics that matter. A faster site makes more money. Not because Google ranks it higher. Because visitors convert better.
A page that loads in two seconds converts better than a page that loads in eight seconds. The Core Web Vitals score didn't cause the conversion improvement directly. The faster load time did. Core Web Vitals are just the measurement. The user experience is what actually matters.
Fix your Core Web Vitals because a faster, more stable site is better for your visitors. The ranking benefit is a nice bonus. Not the main reason to care.
Why Core Web Vitals Matter Beyond Rankings
The real reason Core Web Vitals matter is user experience. A slow page. A page that jumps around. A page that doesn't respond to clicks. These things annoy people. Annoyed people leave. They bounce. They don't convert. They don't come back. They might remember your brand as "that slow site" and avoid clicking your results in the future.
That's where Core Web Vitals actually impact your business. Not through a tiny ranking boost. Through visitors who stick around instead of leaving in frustration.
Google cares about Core Web Vitals because they care about sending users to pages that work well. If Google sends someone to a page that takes ten seconds to load, that reflects poorly on Google. The ranking signal is Google's way of incentivizing better user experiences. It's not punishment. It's incentive.
Faster pages also improve the experience for AI-powered browsers and assistants that fetch live web pages, although Core Web Vitals themselves are designed around human user experience.
Our SEO guide for beginners covers how all ranking factors fit together.
Largest Contentful Paint Explained
LCP measures how long it takes for the largest visible element on your page to load.
Usually that's a hero image. A large text block. A video thumbnail. Something big that dominates the visible area when someone lands on your page. Google measures from when the page starts loading to when that element appears. It's the moment the page feels useful.
A good LCP is 2.5 seconds or less. Needs improvement is up to 4.0 seconds. Poor is anything above that. The thresholds feel aggressive until you realize how impatient people are.
What makes LCP slow? Usually one of a few things.
Large images are the biggest culprit. I see this constantly. Someone uploads a photo straight from their camera. It's 5MB and 6000 pixels wide. The browser downloads all that data just to show a thumbnail-sized version. Most hero images don't need to be anywhere near that large. Resize them to the actual display size. Compress them. Use modern formats like WebP or AVIF.
Our image compressor and PNG to WebP converter handle image optimization without visible quality loss. Our image SEO checklist covers the full optimization picture.
Slow server response times. If your server takes two seconds just to start sending data, you've already used up most of your LCP budget. Good hosting matters. Cheap shared hosting is the most expensive option when you factor in lost visitors.
Render-blocking resources. JavaScript and CSS that the browser has to download and process before it can show anything on the page. Large CSS frameworks loaded in the head. Analytics scripts. Font files. Anything that blocks rendering. The browser can't show the page until it processes these.
Slow or absent content delivery networks. If your server is in Virginia and your visitor is in Australia, the data has to travel halfway around the world. A CDN puts copies of your content closer to visitors. It's one of the simplest performance wins.
Client-side rendering. If your page is built entirely with JavaScript that only renders after downloading and executing, the browser has nothing to show until all that JavaScript finishes running. This is common with React and similar frameworks. Server-side rendering or static generation helps significantly.
Fixing LCP usually means making the most important content on your page appear faster. Compress images. Use a CDN. Reduce render-blocking resources. Get better hosting. Preload important resources. The specific fix depends on what's slowing your page down. PageSpeed Insights tells you exactly what to fix.
Interaction to Next Paint Explained
INP measures how quickly your page responds to user interactions.
Someone clicks a menu button. They tap a product thumbnail. They type in a search box. INP measures the time between the interaction and the next visual update on the screen. Did the page actually respond? How long did it take? It's not measuring just the first interaction. It's measuring all of them throughout the page visit.
A good INP is 200 milliseconds or less. Needs improvement is up to 500 milliseconds. Poor is anything above that. 200 milliseconds is fast. You can feel delays shorter than that.
INP replaced First Input Delay in March 2024. FID only measured the first interaction. A page could have great FID because the first click was fast, then terrible responsiveness for everything after. INP catches that. It's a more honest measurement.
What makes INP slow? Long JavaScript tasks. When the browser is busy processing JavaScript, it can't respond to user input. The user clicks. Nothing happens. The JavaScript task finishes. The click finally registers. The delay between click and response is what INP captures.
Large JavaScript bundles are the usual cause. Too much code running on the page. Third-party scripts from analytics, ads, chat widgets, and social media plugins. All that JavaScript competes for the browser's attention. The browser can only do one thing at a time.
Event handlers that do too much work. When someone clicks a button, the code that runs in response to that click should be fast. If it's doing complex calculations or making network requests, the response time suffers. Break up long tasks into smaller ones.
Heavy pages with lots of DOM elements. The more elements on the page, the more work the browser has to do to update them. A page with thousands of DOM nodes responds slower than a page with hundreds. Every element adds overhead.
Fixing INP usually means reducing JavaScript work. Break up long tasks. Defer non-essential scripts. Audit third-party scripts and remove the ones that aren't worth the performance cost. Use PageSpeed Insights to identify specific scripts causing problems. Sometimes the fix is removing a chat widget that nobody uses anyway.
Cumulative Layout Shift Explained
CLS measures how much your page layout shifts while loading.
You know when you're reading an article and suddenly an ad loads and pushes the text down? Or you're about to tap a button and an image loads above it and the button moves? That's layout shift. CLS measures how much that happens and how severe each shift is.
A good CLS is 0.1 or less. Needs improvement is up to 0.25. Poor is anything above that. The numbers are small because they represent the fraction of the viewport that moved. A score of 0.1 means 10 percent of the visible area shifted.
What makes CLS bad? Elements that load without reserved space. An image loads and pushes content down because the browser didn't know how tall the image would be. An ad loads and takes up space that wasn't accounted for. A font loads and changes text size.
Images without width and height attributes. If you don't tell the browser how big an image is, it doesn't reserve space. The image loads. Space appears. Everything shifts. Adding width and height solves this. It's one of the easiest CLS fixes.
Dynamically injected content. Ads. Newsletter signup forms. Chat widgets. Anything that appears after the page loads can cause layout shift if space isn't reserved for it. This is harder to fix because you often don't control the third-party code. If an ad network sends you a larger ad than expected, your layout shifts.
Web fonts causing layout shifts. The browser starts rendering text with a system font. The web font loads. The text size changes. The layout shifts. Using font-display: optional or preloading fonts can help. Setting fallback fonts that match your web fonts in size also works.
Animations that change layout properties. Not all animations cause CLS. Animations using CSS transform don't trigger layout changes. Animations that change width, height, top, or left do. Stick to transform and opacity for animations.
Fixing CLS usually means reserving space for everything that might load. Set dimensions on images and videos. Reserve space for ads and embeds. Load fonts in a way that doesn't cause shifts. Test your pages on slow connections to see what jumps around.
How to Check Your Core Web Vitals
Google provides several free tools for measuring Core Web Vitals. You don't need to buy anything.
PageSpeed Insights is the most accessible. Paste a URL. It shows LCP, INP, and CLS scores along with specific recommendations. It uses both lab data and field data. The recommendations are usually actionable. It tells you what to fix and how much improvement to expect.
Google Search Console has a Core Web Vitals report under the Experience section. It shows how your pages perform across desktop and mobile. Pages are grouped as Good, Needs Improvement, or Poor. Click through to see which specific pages have problems. This report uses field data from real Chrome users. It's what Google uses to evaluate your site.
The Chrome User Experience Report (CrUX) provides field data from real Chrome users. PageSpeed Insights uses this data. So does Search Console. It's the source of truth for how actual users experience your site. You can query it directly through BigQuery if you need detailed analysis.
Lighthouse, built into Chrome DevTools, audits individual pages and provides detailed recommendations. More granular than PageSpeed Insights. Useful for debugging specific issues during development.
The Web Vitals Chrome extension shows real-time metrics as you browse. Useful for testing pages during development. It shows LCP, INP, and CLS in the corner of the screen as you interact with a page.
Our core web vitals checklist covers the full optimization process.
Common Core Web Vitals Problems and Fixes
Most problems fall into a few patterns. Here's what usually helps.
Images are too large. This is the most common LCP problem. Someone uploads a photo straight from their camera. It's enormous. The browser struggles. Resize images to the actual display size. Compress them. Use modern formats. This alone fixes most LCP issues on content sites.
Too much JavaScript. The average website loads far more JavaScript than it needs. Analytics scripts. Marketing scripts. Chat widgets. Social media buttons. Every script adds download time and processing time. Audit your third-party scripts. Remove the ones that don't provide real value. You probably don't need five different analytics tools.
Slow server response time. Your server might be the bottleneck. Cheap shared hosting often means slow response times. Upgrade your hosting. Use a CDN. Enable caching. These three changes fix most server-side performance issues.
No CDN or caching. If your site is hosted in one location, visitors far away experience slow load times. A CDN distributes your content globally. Caching stores pre-built versions of your pages so the server doesn't have to rebuild them for every visitor. Both are standard practice now.
Render-blocking resources. CSS and JavaScript that load in the page head block rendering. The browser can't show anything until these resources download and process. Inline critical CSS. Defer non-essential CSS and JavaScript. Use async or defer attributes on script tags. This is more technical but has significant impact.
Fonts causing layout shifts. Web fonts that load after the page renders cause text to reflow. Preload important fonts. Use font-display: optional to prevent invisible text. Set fallback fonts that match your web fonts in size. Small changes. Noticeable improvement.
Common Core Web Vitals Myths
There's a lot of confusion around Core Web Vitals. Let me clear up some of the most persistent myths.
Myth: Core Web Vitals guarantee higher rankings. They don't. They're a relatively small ranking signal. You can have perfect scores and still rank poorly if your content is thin and your backlinks are weak.
Myth: The PageSpeed Insights score and Core Web Vitals are the same thing. They're not. The PageSpeed score is a weighted average of several performance metrics. Core Web Vitals are three specific metrics. You can have a great PageSpeed score with poor Core Web Vitals, and vice versa.
Myth: Green scores mean your SEO is done. Green just means you passed the threshold. There's still content to write. Links to earn. User experience to improve. Core Web Vitals are one piece of a much larger puzzle.
Myth: Desktop and mobile scores are the same. They're almost never the same. Mobile scores are usually worse because mobile devices have slower processors and connections. Google uses mobile scores for page experience evaluation.
Myth: If lab data is green, field data must be green too. Lab data is a simulation. Field data is reality. They can disagree for weeks while field data catches up to your improvements. Trust the field data.
Core Web Vitals for WordPress Sites
WordPress sites have specific Core Web Vitals challenges. I've worked on enough of them to know the patterns.
Too many plugins is the biggest one. Every plugin adds JavaScript and CSS. Some add a lot. A WordPress site with 40 plugins is loading scripts from 40 different sources. They might conflict. They might load in the wrong order. They definitely slow things down. Audit your plugins. Remove the ones you don't need. Find lightweight alternatives for the ones you do. You probably don't need that plugin that adds a single feature you could replicate with a few lines of code.
Page builder bloat is another. Page builders like Elementor, Divi, and WPBakery add significant code to your pages. The visual editing is convenient. The performance cost is real. If you're using a page builder, test your Core Web Vitals. Some page builders are better than others. Some configurations are better than others. Sometimes the default settings are the problem.
Caching helps significantly. A good caching plugin stores pre-built versions of your pages. Instead of WordPress generating the page from scratch for every visitor, it serves the cached version. This reduces server response time and improves LCP. WP Rocket, Flying Press, and W3 Total Cache are common options. Don't use multiple caching plugins. One is enough. Two causes problems.
Image optimization plugins help with LCP. Plugins like ShortPixel, Smush, and Imagify compress images automatically when you upload them. Some also convert images to WebP. This solves the large image problem without manual effort. Set it up once. Let it run.
Hosting matters more on WordPress than on static sites. WordPress is dynamic. Every page view involves database queries and PHP processing. Cheap shared hosting means slow response times. Managed WordPress hosting or VPS hosting significantly improves server response time. The hosting cost difference is usually less than the revenue lost to slow load times.
Our WordPress SEO checklist covers performance optimization alongside other WordPress-specific factors.
When to Prioritize Core Web Vitals
Not every site needs to obsess over Core Web Vitals right now. Prioritization matters.
If your site takes eight seconds to load, fix that. That's not a Core Web Vitals problem. That's a fundamental performance problem. Visitors are leaving before the page even appears. Fix the big performance issues first. Get load times under three seconds. Then worry about the metrics.
If your site loads in three seconds and your Core Web Vitals are yellow, it's worth improving but not an emergency. Work on it incrementally. Compress images. Remove a few scripts. Improve hosting. Small changes add up. You don't need to fix everything at once.
If your site loads in under two seconds and your Core Web Vitals are green, you're done. Move on to other SEO priorities. There's always something else to work on. Don't spend weeks chasing a perfect 100 score when you're already providing a good experience.
The sites that benefit most from Core Web Vitals optimization are the ones with obvious performance problems. Sites on slow hosting. Sites with unoptimized images. Sites with dozens of third-party scripts. Fixing the obvious stuff gets most of the benefit.
The sites that benefit least are the ones already performing reasonably well. Eventually, you spend a lot more time chasing tiny improvements than you'll ever get back in SEO results. Your time is probably better spent on content or links.
Core Web Vitals are one part of SEO. Not the most important part. Not one to ignore either.
Fix the obvious problems first. Large images. Slow hosting. Too many scripts. These improvements make your site faster for visitors and better for Core Web Vitals at the same time. The ranking benefit is small. The user experience benefit is real. A faster site is better for everyone.
Don't chase perfect scores if you're already in the green. Improving from poor to good matters a lot. Improving from good to perfect matters a little. The time you spend on that last 10 percent might be better spent on content or links.
Use the tools Google provides. PageSpeed Insights tells you what's wrong and how to fix it. Search Console shows which pages have problems. Fix the pages that matter most first. Your homepage. Your best content. Pages that actually get traffic.
If your pages consistently pass Core Web Vitals, your SEO effort is usually better spent improving content quality, internal linking, and topical authority. The scores will still be green when you come back. The work on the rest of your site won't do itself.