PageSpeed Insights is probably the most used and most misunderstood tool in SEO. People paste a URL. They see a score. If it's green, they're happy and move on. If it's red, they panic and start randomly changing things.
Neither reaction is useful.
The tool gives you a lot more than a score. It tells you what's wrong. It tells you how much each fix might help. It tells you how real users actually experience your page. But you have to know which parts of the report to pay attention to and which parts to ignore.
I've spent way too much time staring at PageSpeed Insights reports. Let me walk through what everything means and how to actually use the information.
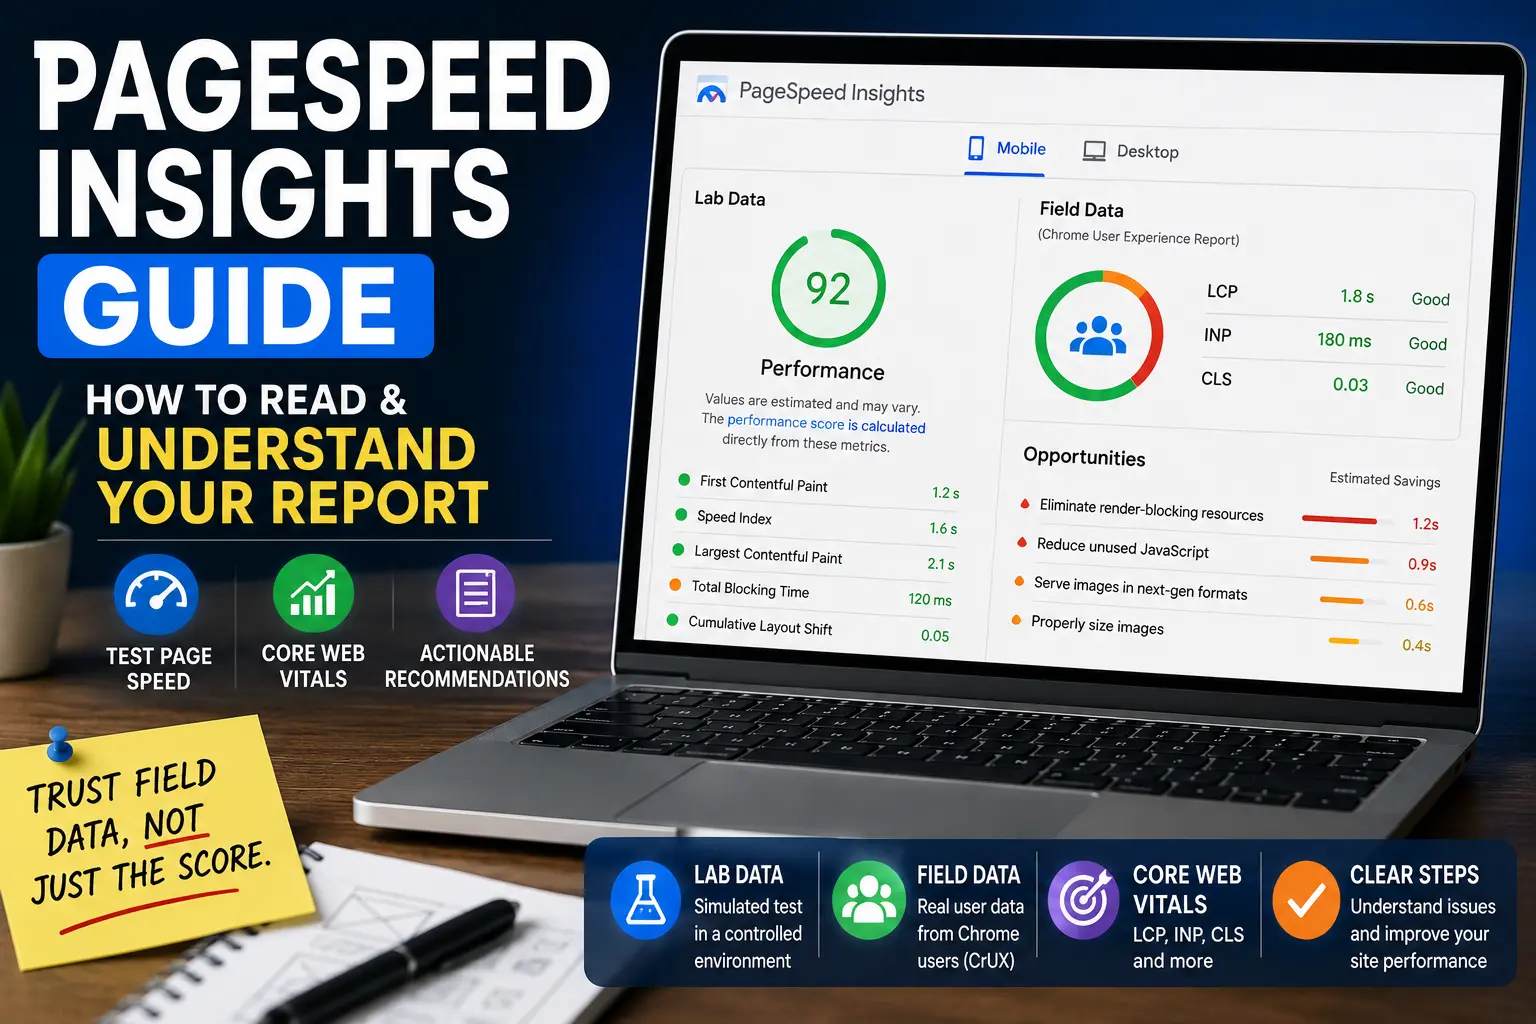
What Is PageSpeed Insights
PageSpeed Insights is Google's free tool for measuring how fast your web pages load and how stable they are while loading.
It's not a generic speed test. It's specifically designed around Google's Core Web Vitals metrics. It measures LCP, INP, and CLS. It also measures several other performance metrics. And it gives you specific, actionable recommendations for improving each one.
PageSpeed Insights is powered by Lighthouse, Google's open-source performance auditing tool. Lighthouse generates the lab data, while field data comes from the Chrome User Experience Report (CrUX), a public dataset that collects anonymous performance data from millions of Chrome users. Google uses this real-world data for Core Web Vitals reporting in both Search Console and PageSpeed Insights.
You can access it at pagespeed.web.dev. Paste a URL. Click analyze. No account or Google login is required. Wait a few seconds. Get your report.It works for any publicly accessible page, not just your own site. You can test competitor pages too. I've tested plenty of competitor sites to figure out why they were outranking me. Sometimes the answer was performance. Sometimes it wasn't.
Our Core Web Vitals guide covers the metrics themselves in detail if you need a refresher on what LCP, INP, and CLS actually measure.
How to Run a PageSpeed Insights Test
Using the tool is straightforward. People still get confused about a few things.
Paste the full URL. Include the https:// part. Don't just type the domain. The tool needs the exact page address. https://yoursite.com/blog/post-name works. yoursite.com might not. I've watched people paste bare domains and wonder why the test failed.
Wait for the analysis to complete. It usually takes 5 to 15 seconds. Slow pages naturally take longer to analyze. The tool is loading your page in a simulated environment and measuring everything.
The report shows two sets of data at the top: lab data on the left and field data on the right (when available). Not every page has field data. Pages with low traffic often don't have enough real user data for Google to show field metrics. That's normal. It doesn't mean anything is wrong. It just means not enough people have visited that specific page.
Scroll down for the detailed sections. Core Web Vitals assessment. Performance metrics. Recommendations. Diagnostics. Passed audits. Each section tells you something different. Don't skip to the score and ignore everything else. The score is the least useful number on the page.
Test on both mobile and desktop. The tab at the top switches between them. Mobile scores are almost always worse. Slower simulated connection. Slower simulated device. This is intentional. Google wants to show you how the page performs for the majority of users, and the majority of users are on mobile.
Understanding the Performance Score
The big number at the top gets all the attention. It's the least useful part of the report.
The performance score is a weighted average of several metrics. LCP. Total Blocking Time. CLS. Speed Index. First Contentful Paint. Each one contributes a different percentage to the final score. The exact weighting changes occasionally when Google updates Lighthouse.
A score of 90 to 100 is green. Good. 50 to 89 is yellow. Needs improvement. 0 to 49 is red. Poor.
The score is useful for quick comparisons. Does this page score higher than that page? Did my score improve after making changes? It's a summary. Not the full story.
What the score doesn't tell you is whether your page feels fast to actual users. A page can score 95 and still have a terrible user experience if the content is hidden behind a loading spinner. A page can score 60 and feel perfectly fine if the important content loads immediately. The score measures specific technical metrics. It doesn't measure perceived performance.
I've seen site owners obsess over getting from 89 to 90. That one-point difference changed the color from yellow to green. It didn't change anything about how the page loaded. The user experience was identical. The site owner felt better. The users noticed nothing. I've been that site owner. The satisfaction is temporary.
Don't chase the score. Chase the user experience. Use the score as a general indicator. Pay more attention to the specific metrics and recommendations.
Lab Data vs Field Data
This section confuses more people than anything else in the report.
Lab data comes from a simulated test. Google loads your page in a controlled environment. A specific device. A specific network speed. A specific location. The results are consistent and repeatable. Run the test twice and you'll get similar results. Lab data is great for debugging because you can make a change and immediately see the impact. Fix an image. Retest. See the improvement instantly.
Field data comes from the Chrome User Experience Report (CrUX), which collects anonymous performance data from real Chrome users. People who actually visited your page. On their actual devices. With their actual network connections. Over the past 28 days. It's aggregated and anonymized. You can't trace it back to specific users. But it shows you what real people experienced.
If lab data and field data disagree, trust the field data. That's what Google uses for Core Web Vitals evaluation. If your field data shows LCP is green, your LCP is green. The lab data might show yellow because the simulated device is slower than your actual users' devices. The field data is reality. The lab data is a simulation of reality.
Field data takes time to update. If you fix something today, you won't see the improvement in field data for up to 28 days. The old data has to age out of the rolling average. Lab data updates immediately. This is why people get frustrated. They fix something. They run the test. The lab score improves. But Search Console still shows yellow for weeks. That's normal. Be patient.
Not every page has field data. Pages with low traffic might not have enough real user visits for Google to show field metrics. The page simply doesn't get enough Chrome traffic for the CrUX dataset. That's fine. Use lab data as your guide until traffic increases.
Why PageSpeed Insights and Search Console Don't Match
This is one of the most common questions I get. Someone fixes their LCP. PageSpeed Insights shows green. Search Console still shows yellow. They panic and assume the fix didn't work.
The fix probably worked. The tools just measure differently.
Here's a quick comparison:
| PageSpeed Insights | Search Console |
| Instant test | 28-day rolling average |
| Lab data and field data | Field data only |
| Any public URL | Verified properties only |
| Immediate feedback | Historical trends |
| Debugging and testing | Monitoring and reporting |
PageSpeed Insights shows a snapshot. The lab data is from a test run right now. The field data is from the most recent CrUX snapshot, which updates daily but represents the previous 28 days. When you fix something, the lab data improves immediately. The field data starts improving but old data from before the fix still counts toward the average.
Search Console also uses CrUX field data over a 28-day rolling window. But the reporting isn't always in perfect sync with PageSpeed Insights. Search Console reports update on their own schedule. There can be a lag of several days beyond the 28-day data window.
If PageSpeed Insights shows green Core Web Vitals and Search Console still shows yellow, wait. Give it a month from when you made the fix. If Search Console is still yellow after four weeks, the fix might not have been effective for real users. Check the field data in PageSpeed Insights. If that's green too, Search Console will catch up eventually.
Also worth noting: Search Console reports on a per-page basis using actual user data. PageSpeed Insights lab data is a single simulated test. They're measuring different things in different ways. Some disagreement is normal.
Core Web Vitals Assessment
This section shows whether your page passes Google's Core Web Vitals thresholds.
It shows LCP, INP, and CLS. For each one, it shows whether the page passes based on field data. Green checkmark means passes. Red X means fails. Gray means no field data available.
The assessment is binary. Pass or fail. There's no partial credit. A page with LCP of 2.4 seconds passes. A page with LCP of 2.6 seconds fails. The threshold is 2.5 seconds. Being close doesn't count. I've seen pages sitting at 2.5 seconds exactly and it's nerve-wracking. One slow user and it tips over.
This section matters because it's what Google uses for the page experience ranking signal. If all three metrics pass, your page meets Google's Core Web Vitals threshold. If any one fails, it doesn't. The assessment is per-page, not site-wide. You can have some pages passing and some failing.
Our how to improve LCP guide, how to fix CLS guide, and how to improve INP guide cover fixing each metric individually.
Performance Metrics Section
Below the Core Web Vitals assessment, you'll see a list of performance metrics with timings.
First Contentful Paint measures when the first bit of content appears. Any content. A text character. An image. Anything visible. It's a precursor to LCP. A slow FCP usually means a slow LCP. The fix for one often fixes the other.
Total Blocking Time measures how long the main thread was blocked by JavaScript. This correlates with INP. If TBT is high, your page is spending too much time running JavaScript and not enough time responding to users. Long tasks. Heavy scripts. The browser can't multitask.
Speed Index measures how quickly the page visually fills in. It's a composite metric. Lower is better. It's useful for understanding perceived performance but not directly tied to Core Web Vitals.
Time to Interactive measures when the page becomes fully interactive. Not just visible. Ready for the user to click and type and scroll. This is aspirational. Many pages never reach TTI in the lab test. If yours does, that's genuinely impressive.
These metrics provide context for your Core Web Vitals scores. If LCP is slow, check FCP. If FCP is also slow, the problem starts early in the page load. Server response time. Render-blocking resources. If FCP is fast but LCP is slow, the problem is specifically with the largest element, not the entire page. That points to an image or a large text block.
Opportunities Section
This is the most actionable part of the report.
The Opportunities section lists specific things you can fix, with estimated time savings for each one. "Properly size images" might save 2.1 seconds. "Eliminate render-blocking resources" might save 0.8 seconds. "Reduce unused JavaScript" might save 0.5 seconds.
The time savings are estimates. They assume you fix the issue completely. Your actual savings might be different. But the estimates tell you which fixes are worth prioritizing. A fix that saves 2 seconds matters more than a fix that saves 0.1 seconds. Prioritize accordingly.
Each recommendation expands to show more detail. Which specific images need resizing. Which scripts are render-blocking. Which JavaScript files have the most unused code. You get a list of problems, not just a category. This is what makes the tool useful. It doesn't just tell you to optimize images. It tells you which images.
Start with the biggest time savings. Fix the things that will have the most impact. Don't try to fix everything at once. Pick the top one or two recommendations. Fix them. Retest. See the score improve. Move to the next ones.
The recommendations are ordered by estimated impact. The top item is usually the one that will help the most. It's not always right. Sometimes the second or third item is easier to fix and produces nearly as much benefit. Use judgment. A fix that saves 1.8 seconds and takes an hour is better than a fix that saves 2.1 seconds and takes a week.
Diagnostics Section
The Diagnostics section provides additional information that doesn't fit neatly into the Opportunities format.
"Avoid large layout shifts" shows specific elements that caused CLS. This is gold for debugging layout stability issues. It tells you exactly which element moved and how much it contributed to your CLS score. Not "something shifted." That specific image at line 247 shifted by 0.15.
"Largest Contentful Paint element" shows which specific element was measured as the LCP. Usually an image. Sometimes a text block. Knowing which element it is tells you what to optimize. It's often a hero image you didn't realize was the bottleneck.
"Reduce JavaScript execution time" shows which scripts consumed the most main thread time. This helps with INP debugging. If one script is taking 800 milliseconds to execute, that's your bottleneck. You might be able to remove it entirely.
"Avoid enormous network payloads" shows the total page size and which resources contribute the most. If your page is 8MB and half of that is images, you know where to focus. If a single JavaScript bundle is 2MB, that's a problem.
Diagnostics aren't directly scored. They're information. Use them to understand why your scores are what they are and what's contributing to problems. They're the context behind the numbers.
Passed Audits Section
This section shows things your page is already doing right.
It's easy to ignore. Everyone focuses on the problems. But the passed audits tell you what's working. "Uses efficient cache policy." "Avoids excessive DOM size." "Serves images in next-gen formats." These are things you don't need to worry about.
If you're fixing things and scores aren't improving, check the passed audits. Maybe you're trying to fix something that's already fine. Maybe the problem is somewhere else entirely.
The passed audits also give you a sense of how well-optimized your page already is. A page with 20 passed audits and 2 opportunities is in pretty good shape. A page with 2 passed audits and 15 opportunities needs more work. The ratio tells you something.
How to Automate PageSpeed Insights Testing
If you're testing pages regularly, doing it manually gets old fast.
The PageSpeed Insights API lets you run tests programmatically. You send a request with a URL. You get back the same data you'd see in the web interface. Agencies and larger sites use this to monitor performance across hundreds of pages automatically.
Lighthouse CI runs Lighthouse audits as part of your development workflow. You can set performance budgets and block deployments that degrade scores. It integrates with GitHub Actions, Jenkins, and other CI tools.
The Lighthouse CLI lets you run audits from the command line. You can test local development pages before they go live. This catches performance regressions before they reach production.
For most small sites, the web interface is enough. But if you're managing multiple sites or want to track performance trends over time, the API and CLI options are worth exploring.
How to Prioritize PageSpeed Insights Recommendations
Not all recommendations are equally important. Not all are equally easy to fix.
Usually I start with the things that affect LCP. Image optimization. Server response time. Render-blocking resources. These are often the biggest time savings and affect the Core Web Vital that most sites struggle with.
Then CLS fixes. Setting image dimensions. Reserving space for ads. These are usually easy to implement and have immediate visual impact. You can see the page stop jumping. It's satisfying.
Then INP-related fixes. Reducing JavaScript execution. Breaking up long tasks. These are harder. They might need developer help. But they affect how the page feels to use. A page that responds instantly feels professional.
Ignore recommendations that don't affect your actual user experience. "Minify CSS" might save 0.01 seconds. It's technically correct. It won't change how anyone experiences your page. Focus on the things that matter.
The estimates in the Opportunities section are your guide. If a fix saves multiple seconds, do it. If it saves 0.1 seconds and requires significant work, skip it. There are better uses of your time. Your users won't notice 0.1 seconds.
Why Your PageSpeed Insights Score Keeps Changing
Your score changes between tests. This drives people crazy. You run the test. You get a score of 72. You run it again immediately. You get 68. Nothing changed on your page. The score changed anyway.
Lab tests vary because of network conditions. Server load at the testing location. Internet congestion between the test server and your site. Tiny timing differences in how the page loads. The variance is usually 5 to 10 points. A score that bounces between 68 and 74 is basically the same result. Don't read anything into it.
Field data varies because your actual users vary. Different devices. Different network speeds. Different times of day. Different locations. The field data is a rolling average of all these variations. It smooths out over time.
Don't obsess over small score changes. A five-point difference is noise. A twenty-point difference is worth investigating. The trend matters more than any individual test result. Is your score generally going up or down over weeks and months? That's what matters.
If you're making changes and retesting to see the impact, run the test three times and take the median. Or run it once and don't overthink it. The exact number matters less than whether your changes are improving things. Did the score go up? Good. Did it go down? Something might be wrong. Did it stay the same? Your change might not have mattered.
PageSpeed Insights on Mobile vs Desktop
The mobile and desktop tabs test different things. They're not the same test on different screen sizes.
The mobile test simulates a mid-range phone on a 4G connection. CPU throttling. Network throttling. The simulated device is slower than the actual device you test on. This is intentional. Google wants to show you the experience on a typical device, not a flagship phone. Most of the world doesn't have a flagship phone.
The desktop test simulates a fast desktop computer on a fast connection. No throttling. No CPU limitation. The scores are almost always higher. Sometimes dramatically higher.
Mobile scores matter more. Google uses mobile-first indexing. The majority of web traffic is mobile. The Core Web Vitals thresholds apply to mobile results. If your mobile scores are good, your desktop scores are almost certainly good. The reverse is not true.
If you only have time to fix one, fix mobile. It's harder. The scores are lower. The fixes benefit more users. Desktop is usually fine by comparison. Fixing mobile is like fixing the hardest problem first. Desktop fixes itself along the way.
Our core web vitals checklist covers mobile optimization in more detail.
Common PageSpeed Insights Mistakes
I've made several of these. You'll probably make a few too.
Obsessing over the score instead of the metrics. The score is a summary. The metrics are what matter. A page with a score of 85 and all green Core Web Vitals is better than a page with a score of 92 and a failing LCP. The user cares about how fast the page loads, not the number at the top.
Fixing the wrong things because they're easy. "Minify CSS" is easy. It probably doesn't help much. "Optimize images" requires finding and resizing images. It helps a lot. Do the high-impact fixes first, even if they're harder. Our image compressor and PNG to WebP converter handle image optimization quickly.
Testing only the homepage. The homepage might be your fastest page. It's certainly not your only page. Test your blog posts. Your product pages. Your category pages. Different templates have different performance profiles. Your homepage might score 90 while your product pages score 30. You won't know until you test.
Testing only once. Run the test a few times. Look at the average. A single test can be an outlier. Multiple tests show the pattern. If three tests give scores of 72, 70, and 73, your page scores around 72.
Comparing scores across different pages as if they're equivalent. A blog post with one image will always score higher than a product page with ten images. Compare similar pages to similar pages. Compare the same page over time. Don't compare a blog post to a product gallery and conclude the product gallery is broken. It just has more stuff to load.
Ignoring the recommendations because the score is green. Green doesn't mean perfect. It means above the threshold. There might still be easy fixes worth doing. The recommendations are still valid even if your score is good. A page can score 91 and still have opportunities worth fixing.
Key Takeaways
- Focus on field data over lab data.
- Fix the highest-impact opportunities first.
- Prioritize Core Web Vitals over the overall score.
- Test both mobile and desktop.
- Give Search Console time to reflect real-user improvements.
PageSpeed Insights is a diagnostic tool. It's not a judgment on your website. A low score doesn't mean your site is bad. A high score doesn't mean it's perfect. The tool gives you information. What you do with it is up to you.
Use the tool to find problems. Look at the Opportunities section. Fix the things with the biggest estimated time savings. Retest. See if it helped. Move on. Don't spend hours chasing a one-point improvement that nobody will notice.
Don't chase a perfect score. I've seen sites with a score of 100 that loaded terribly because all the content was deferred until after the test completed. I've seen sites with a score of 40 that felt fast because the critical content loaded immediately and everything else loaded later. The score is a proxy for user experience. Not the experience itself.
The field data matters more than the lab data. The Core Web Vitals assessment matters more than the score. The actual user experience matters more than any number in a report. If your pages feel fast to real people, the numbers will eventually reflect that.
If your Core Web Vitals are green and your pages feel fast, you're done. Close PageSpeed Insights. Go work on something that actually moves the needle for your business. The tool will still be there next month when you want to check again. It always comes back.