For many websites, INP is often the most challenging Core Web Vital to improve because it depends heavily on JavaScript execution. LCP is mostly about images and hosting. CLS is mostly about setting dimensions on things. Both are relatively straightforward once you understand them. You can fix most LCP and CLS problems without touching JavaScript.
For most websites, INP problems are primarily caused by JavaScript. How much of it you have. What it's doing. When it runs. And whether it's getting in the way of your visitors trying to click buttons, open menus, or type in forms. > It's the Core Web Vital where JavaScript quality usually matters the most.
The deeper fixes usually require a developer. I want to be upfront about that. Some fixes you can do with plugins and settings changes. Removing unnecessary scripts. Deferring what you can. But the deeper INP problems live in your JavaScript code. You'll probably need someone who can read and modify that code.
That said, understanding what's wrong and why is the first step. Even if you can't fix it yourself, knowing what to ask for makes the conversation with a developer much shorter and cheaper. You can point at specific problems instead of saying "the page feels slow."
What Is Interaction to Next Paint
Interaction to Next Paint measures how quickly your page responds when someone interacts with it.
Someone clicks a button. How long until the screen updates? Someone taps a menu icon. How long until the menu appears? Someone types in a search box. How long until the characters show up? It's measuring the delay between a real person doing something and the page acknowledging that something happened.
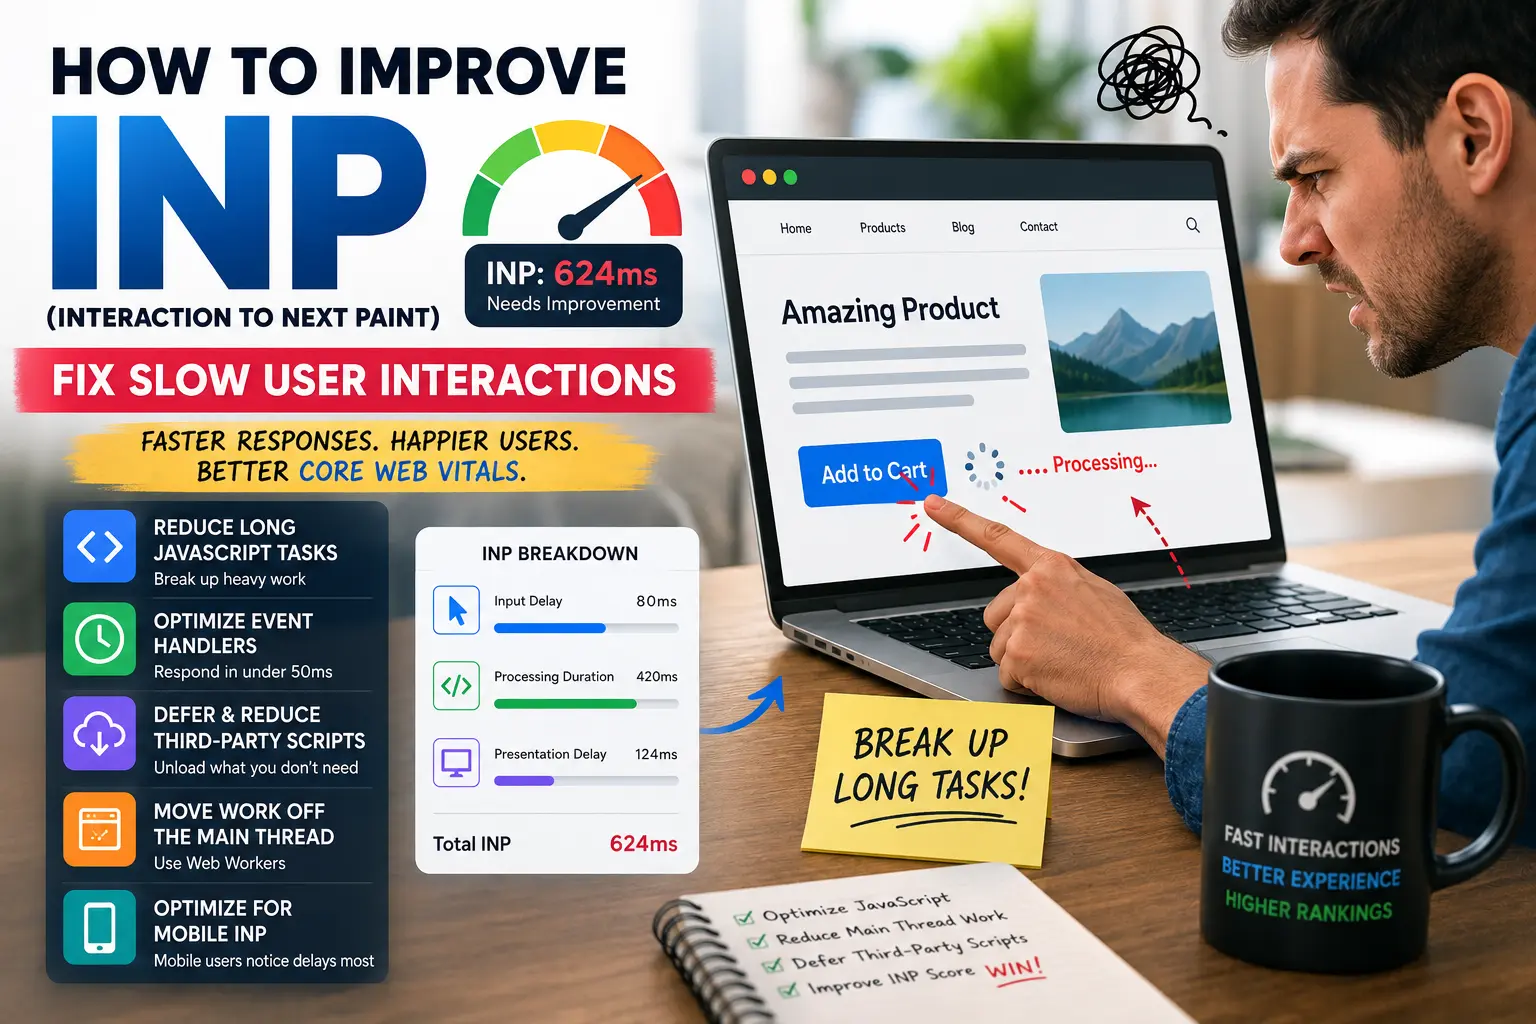
Every INP measurement includes three parts: input delay (the time before the event handler starts), processing duration (the time the event handler takes to run), and presentation delay (the time to render the next frame). Improving any of these reduces the final INP score. Most optimization focuses on processing duration, but the other phases matter too.
Here's how INP compares to the other Core Web Vitals:
| Metric | Measures | Good Score |
| LCP | Loading speed | ≤ 2.5 seconds |
| CLS | Visual stability | ≤ 0.1 |
| INP | Responsiveness | ≤ 200 milliseconds |
INP measures the worst interaction over the entire page visit. Not the first interaction. Not the average interaction. The slowest one. That's what makes it harder to fix than FID, which only measured the first input. You could optimize the first click and call it done. INP watches everything.
A good INP is 200 milliseconds or less. Between 200 and 500 milliseconds needs improvement. Above 500 milliseconds is poor. Two hundred milliseconds is fast. You can feel delays shorter than that. A 500-millisecond delay feels like the page is broken. You click. Nothing happens. You click again. Both clicks fire at once. You're not sure if the first one registered.
Because of this, Google replaced FID with INP in March 2024. INP watches every interaction throughout the page visit. You can't hide bad responsiveness behind a fast initial load anymore.
Our Core Web Vitals guide covers how INP fits alongside LCP and CLS.
What Makes INP Slow
For most websites, INP problems are primarily caused by JavaScript. The longer answer is what JavaScript is doing while the user is trying to interact with the page.
The browser can only do one thing at a time on the main thread. It can render the page. Or it can run JavaScript. Or it can respond to a click. Not all three simultaneously. If JavaScript is running when the user clicks, the click gets queued. It waits. Then JavaScript finishes. Then the click gets processed. Then the screen updates. The delay between the click and the screen update is what INP measures.
What's running on the main thread during those delays? Usually long tasks. A long task is any JavaScript execution that takes more than 50 milliseconds without a break. Fifty milliseconds doesn't sound like much. It's a fraction of a second. But if someone clicks while a long task is running, they wait. And wait. And maybe click again because nothing happened. And then both clicks fire at once and the page does something unexpected.
Common sources of long tasks include large JavaScript bundles that parse and execute on page load. The browser downloads your entire application code. It parses it all. This blocks the main thread. If the user tries to interact during this parsing, they wait.
Analytics scripts. Chat widgets. Marketing pixels. These run on timers. They wake up periodically and do work. If they wake up right when the user clicks, the click waits for the script to finish.
Event handlers that do complex calculations instead of responding quickly. Someone clicks a button. The handler runs a sort operation on a thousand items. The sort takes 300 milliseconds. The user waits. The screen doesn't update. The interaction feels broken.
Although JavaScript is the most common cause of poor INP, expensive rendering work triggered by complex CSS layouts or large DOM updates can also delay the next paint. CSS properties such as content-visibility: auto can reduce rendering work for off-screen content, helping keep interactions responsive.
Third-party scripts are often the worst offenders. You don't control what they do. They run when they want. They take as long as they want. A chat widget that processes its entire configuration on the main thread during a click event. An analytics script that does heavy computation while the user is trying to interact with the page. You didn't write this code. It's still hurting your INP.
Our free SEO checker identifies INP issues alongside other technical problems.
Why INP Is Often Worse on Mobile
INP problems get amplified on mobile devices. A page that feels responsive on a desktop can feel sluggish on a phone. The hardware gap is real.
Desktop computers have fast processors. Plenty of memory. Good cooling. Mobile phones have slower processors that throttle under sustained load. Less memory. No fans. JavaScript that runs fine on a desktop can struggle on a mid-range Android phone or an older iPhone.
Low-end devices are especially affected. A budget Android phone from two years ago might process JavaScript three or four times slower than a current flagship. The same code that completes in 100 milliseconds on a fast desktop might take 400 milliseconds on a budget phone. That's the difference between Good and Poor INP.
This is why Google measures INP from real Chrome users on their actual devices. Lab tests on your fast development machine might show everything is fine. Real users on real phones might be having a very different experience.
When testing INP, don't just test on your laptop. Test on an actual phone. Borrow a friend's older phone if you can. Use Chrome DevTools device emulation with CPU throttling enabled. The throttling simulates a slower device. It's not perfect, but it's closer to what real users experience.
If your INP is good on mobile, it's almost certainly good on desktop. Optimize for the worst device your users are likely to have. Not the best one.
How to Measure INP and Find the Problem
You can't fix what you can't measure. And INP is harder to measure than LCP or CLS because it depends on real user interactions. It's not a lab metric. It's a field metric.
PageSpeed Insights includes INP data if there's enough field data from Chrome users. Lab data doesn't include INP directly because it requires real interactions. But the lab test can show Total Blocking Time, which correlates with INP. Total Blocking Time (TBT) is only a lab proxy for INP. Improving TBT often improves INP, but a good TBT score doesn't guarantee a good INP because INP measures real user interactions rather than simulated ones.
The Chrome User Experience Report has INP data. Search Console's Core Web Vitals report shows INP scores for your pages. This is field data from real Chrome users. It's the most accurate measurement you have. It takes time to update. Changes you make today might not show up for weeks. But it's the truth.
Real User Monitoring (RUM) tools such as Chrome UX Report or custom analytics can help identify slow interactions experienced by real visitors. These tools capture timing data from actual page visits, giving you a clearer picture than lab simulations alone. Developers can also use the Event Timing API to measure interaction latency programmatically.
Chrome DevTools has a Performance panel that records interactions. Open DevTools. Go to the Performance tab. Click record. Interact with the page. Click buttons. Open menus. Type in forms. Stop recording. Look for long tasks in the main thread timeline. The flame chart shows exactly what JavaScript was executing when. You'll see spikes of yellow and red where the main thread was busy. Chrome DevTools can also highlight Long Animation Frames (LoAFs), making it easier to identify rendering work that delays user interactions.
Lighthouse, built into Chrome DevTools, also audits pages for performance issues related to INP. It provides detailed recommendations for reducing JavaScript execution time and breaking up long tasks.
The Web Vitals Chrome extension shows real-time INP metrics as you interact with a page. Click around. Watch the numbers. See which interactions are slow. This is the fastest way to find problem areas. You can test specific buttons, specific menus, specific form fields and see the INP in real time.
What usually helps most is identifying which specific interactions are slow. Not "the page is slow." But "clicking the add-to-cart button takes 800 milliseconds." Specific problems lead to specific fixes. You can hand a developer a specific button and say "make this faster" instead of "make the page faster."
Break Up Long JavaScript Tasks
Long tasks are the main cause of poor INP. The fix is breaking them into smaller pieces.
A long task is any JavaScript work that takes more than 50 milliseconds without yielding control back to the browser. While that task runs, the browser can't respond to clicks or taps. The user feels the delay. They don't know what's happening. They just know nothing is responding.
Breaking up long tasks means inserting yields. Give the browser a chance to handle pending input before continuing with the work. It's like taking breaks during a long drive. You still get where you're going. You just don't exhaust yourself getting there.
setTimeout with a zero delay schedules work for the next available moment. The browser processes any pending input first. Then runs the scheduled code. It looks like setTimeout(() => { doNextChunk(); }, 0). This gives the browser a breath between chunks of work. The total time is the same. The responsiveness is much better.
requestAnimationFrame() is best for visual updates that need to happen before the next repaint. Avoid putting heavy computations inside it because they can still delay rendering. Useful for visual updates. Less useful for data processing. The browser handles input between frames. It's good for keeping animations smooth while staying responsive.
requestIdleCallback schedules work for when the browser is idle. The browser runs the callback during periods when it's not doing anything else. Good for low-priority work that doesn't need to happen immediately. Because idle time isn't guaranteed, it shouldn't be used for work that must complete quickly. Not all browsers support it consistently. But it's useful where available.
Newer browsers also support scheduler.yield(), allowing long-running JavaScript to pause and let the browser process pending user interactions before continuing. This is the newest recommendation from Chrome for breaking up long tasks. Some applications also use navigator.scheduling.isInputPending() to check whether user input is waiting before continuing long-running work.
The Scheduler API is newer and more explicit. scheduler.postTask() lets you prioritize tasks. High priority for user-facing work. Low priority for background work. Not all browsers support it yet, but it's the direction things are heading. It gives you the most control over when work happens.
Modern bundlers like Vite, Webpack, and Next.js support code splitting so only the JavaScript needed for the current page is downloaded initially. Smaller bundles parse faster and block the main thread for less time.
For data processing, process items in batches. If you need to process a thousand items, do fifty at a time with a yield between each batch. The total processing time is the same. But the browser can handle clicks between batches. The user never feels stuck. They can interact normally while the work happens in small chunks.
This is developer work. You need someone who understands your JavaScript codebase and can identify where long tasks happen. But the concept is simple. Chop big blocks of synchronous work into smaller pieces. Let the browser breathe between pieces. The total work hasn't changed. The user experience has.
Optimize Event Handlers
Event handlers run in response to user interactions. They should be fast. The user clicked. The handler should respond. The screen should update. If the handler itself is slow, INP suffers.
The first fix is making handlers do less work. If a click handler triggers a complex calculation, move that calculation elsewhere. Cache the result. Precompute it. Do it on the server. A click handler should update the UI and nothing more. The user clicked. The screen changed. Done.
For scroll and touch events, use passive event listeners whenever possible. This tells the browser the event won't call preventDefault(), allowing smoother scrolling and reducing input delay. Google has recommended this for years. It's a small change with measurable impact.
Defer non-essential work. If a click handler needs to update the UI and also send analytics data, update the UI first. Send the analytics data later. The user sees the response immediately. The analytics fire in the background. Nobody's experience should be delayed by tracking code.
Debounce rapid interactions. If someone is typing in a search box, you don't need to process every keystroke. Wait until they pause. Then process. The user sees responsive typing. The heavy work happens once when they stop. This is standard practice for search inputs and it's exactly the pattern that improves INP.
Throttle continuous events. Scroll handlers. Resize handlers. These fire dozens of times per second. If each one does significant work, the main thread is constantly busy. Limit how often the handler runs. Once per animation frame is usually enough. Nobody can perceive 60 scroll events per second.
Use requestAnimationFrame for visual updates in handlers. If a click changes the page appearance, schedule the visual change for the next animation frame. The browser batches visual updates. It's more efficient than modifying the DOM directly in the handler. The user sees the same result. The work is spread out more evenly.
The pattern is the same as breaking up long tasks. Do the minimum work needed to respond to the user. Defer everything else. The user shouldn't have to wait for your analytics to fire.
Framework-Specific INP Improvements
If your site uses a JavaScript framework, the framework itself can contribute to INP issues. Each framework has specific optimization strategies.
React sites should use React.memo to prevent unnecessary re-renders, implement lazy loading with React.lazy, and avoid expensive calculations inside render methods. Moving state management out of frequently re-rendered components also helps reduce main thread work.
Next.js sites benefit from dynamic imports with next/dynamic to split code at the component level. Server components reduce the amount of JavaScript sent to the client. Static generation eliminates server-side rendering delays entirely for pages that don't need dynamic data.
Vue sites should avoid expensive watchers and computed properties that recalculate more often than necessary. Use v-once for static content that never needs to update. Implement lazy loading for components that aren't visible on initial render.
Angular sites benefit from OnPush change detection strategy, which limits when components re-render. Avoid complex template expressions. Use trackBy with ngFor to minimize DOM manipulation when lists update.
Svelte sites often have good INP out of the box because Svelte compiles components to efficient vanilla JavaScript. Still, avoid expensive reactive statements and use Svelte's built-in transitions rather than custom animation code.
For all frameworks, partial hydration and islands architecture are becoming increasingly relevant for performance-focused sites. Astro and similar tools only send JavaScript for interactive components, leaving static content as pure HTML that doesn't block the main thread at all. Excessive hydration or hydration mismatches can also delay interactions on modern JavaScript frameworks, so keep hydration boundaries small and deliberate.
Reduce Third-Party Script Impact
Third-party scripts are usually the hardest INP problems to fix because you don't control the code. But you do control whether it runs.
Every third-party script on your page runs JavaScript. Analytics. Marketing pixels. Chat widgets. Social media buttons. Comment systems. Some run a lot. Some run at exactly the wrong time, waking up periodically and blocking the main thread when users are trying to interact.
The first step is auditing what you have. Look at your page source. Check your tag manager. List every third-party script. Ask yourself what each one actually does and whether you need it. Be honest. You probably don't need five analytics tools.
Remove the ones you don't need. That social media widget that shows share counts? Nobody uses it. The analytics tool you installed three years ago and never checked? Gone. The chat widget that nobody ever messages? Remove it. Every script you remove is JavaScript that never runs. The main thread is freer. Interactions feel faster. This is the highest-impact, lowest-effort INP fix.
For the scripts you keep, load them efficiently. Use async or defer attributes so they don't block the initial page render. Load them after the page is interactive, not before. Delay non-essential scripts until after the user's first interaction. The chat widget doesn't need to load before the user has even read anything.
Some third-party scripts can be loaded in a web worker. A web worker runs JavaScript on a separate thread. It doesn't block the main thread. The user clicks. The main thread responds instantly. The third-party script does its work elsewhere. Nobody notices.
If a script is causing INP problems and you can't remove it, can't defer it, and can't move it to a worker, contact the vendor. Tell them their script is causing performance issues. They might have a lighter version. They might have configuration options. They might not care. But it's worth asking. Sometimes vendors are surprisingly responsive to performance complaints.
Use Web Workers for Heavy Computation
Web workers run JavaScript on a separate thread. They don't block the main thread. They don't delay user interactions. They're the most effective way to fix INP problems caused by heavy computation.
Anything that does significant data processing, sorting, filtering, or calculating can potentially move to a web worker. The main thread stays free for user interactions. The heavy work happens in the background. The user clicks. The UI responds. The computation runs silently elsewhere.
Common candidates for web workers include search filtering on large datasets, image processing, data parsing, complex calculations, and any operation that takes more than a few milliseconds. If a task takes long enough that a user might click during it, it belongs in a worker.
Web workers have limitations. They can't access the DOM directly. They communicate with the main thread through message passing. You compute in the worker. You send the result back. The main thread updates the UI. It's more complex than doing everything on the main thread. It's also much better for INP.
If you're using a JavaScript framework, check whether it supports web workers. Some frameworks have built-in support. Others have libraries that simplify the process. React has libraries. Angular has built-in support. Vue has plugins. The ecosystem has caught up.
This is developer territory. But it's worth bringing up with your developer if INP is poor and the page does significant data processing. Moving work off the main thread is the most reliable way to improve INP without removing functionality. You keep the feature. The user keeps the responsiveness.
Common INP Fixes for WordPress Sites
WordPress sites have specific INP challenges. Most come from plugins.
Plugins that add JavaScript to every page, even pages where they're not used. A contact form plugin loading its scripts on the homepage. A gallery plugin loading on text-only pages. Every script adds to the JavaScript burden. Audit your plugins. Check which pages each plugin loads on. Remove plugins that are loading unnecessary scripts everywhere. Or use a plugin organizer to restrict scripts to the pages where they're actually needed.
Page builders often generate JavaScript-heavy pages. Elementor. Divi. Beaver Builder. The visual editing is convenient. The JavaScript overhead is real. Some page builders are better than others. Some have performance settings that reduce JavaScript usage. Check your page builder's documentation. There might be settings you can change.
Combine JavaScript files where possible. WordPress sites often load dozens of small JavaScript files. Each file is a separate HTTP request. Each file blocks the main thread while it parses. A caching or optimization plugin can combine these into fewer files. Less overhead. Faster parsing. Fewer network requests.
Delay non-essential JavaScript. Some optimization plugins let you delay specific scripts until user interaction. The script loads. But it doesn't execute until the user clicks or scrolls. This keeps the main thread free for the first few seconds when INP is most critical. Flying Press and WP Rocket have these features.
Choose lightweight themes. Some themes are JavaScript-heavy out of the box. Sliders. Animations. Parallax effects. Dynamic menus. All of these run JavaScript. All of them can affect INP. A simpler theme is often faster and more responsive. It might not look as flashy. It will feel better to use.
Our WordPress SEO checklist covers performance optimization in more detail.
Common INP Mistakes
I've seen these mistakes repeatedly across sites struggling with INP.
- Loading every third-party script immediately on page load instead of deferring or delaying non-essential ones.
- Running expensive click handlers that do too much work synchronously instead of breaking up the work or deferring it.
- Using huge JavaScript bundles without code splitting, forcing users to download and parse code for pages they never visit.
- Animating layout properties like width, height, top, or left instead of using transform and opacity.
- Blocking the main thread with synchronous operations that could be moved to a web worker.
- Testing performance only on desktop while ignoring the slower processors and connections of mobile devices.
- Installing plugins and scripts without auditing whether they're still needed or whether lighter alternatives exist.
- Assuming a fast initial load means the page will stay responsive during interactions.
How to Prioritize INP Fixes
INP fixes have different costs and different impacts. Start with the cheapest.
First, audit and remove unnecessary third-party scripts. This is the highest-impact, lowest-effort fix. Every script you remove is JavaScript that never runs. The main thread stays clearer. INP improves. You might find scripts you forgot existed. You definitely have at least one script you don't need.
Second, defer or delay the scripts you keep. Use async and defer attributes. Load non-essential scripts after user interaction. The scripts are still there. They just don't compete with the user during the first few seconds. The user gets a responsive experience. The scripts run later when it doesn't matter.
Third, optimize event handlers. Make them do less work. Use passive listeners for scroll and touch events. Defer analytics and tracking. Update the UI first. Everything else second. The user sees the response immediately. The background work happens invisibly.
Fourth, break up long tasks. This requires developer work. Identify where the main thread is blocked. Insert yields. Break synchronous work into smaller pieces. Implement code splitting to reduce initial bundle size. The total work is the same. The responsiveness is transformed.
Fifth, move heavy computation to web workers. This is the most complex fix. It also produces the biggest improvement for data-heavy pages. If your page does significant processing, this is where you end up.
Test after each change. INP is measured from field data, so improvements take time to show up in Search Console. But you can test responsiveness manually. Click around the page. Does it feel faster? Do interactions respond immediately? The manual test tells you more than any metric. You know when a page feels responsive.
Our core web vitals checklist covers the full optimization process.
When to Stop Optimizing INP
INP optimization has diminishing returns. A good INP is under 200 milliseconds. If you're already there, stop. You're in the green. The effort to go from 200 milliseconds to 100 milliseconds is much higher than the effort to go from 500 milliseconds to 200 milliseconds.
Focus on the worst pages first. The pages that get the most traffic and have the poorest INP. Fixing a high-traffic page from Poor to Good benefits more users than fixing a low-traffic page from Needs Improvement to Good. Prioritize by impact, not by how easy the fix is.
If a page is fundamentally JavaScript-heavy and fixing it requires rebuilding major functionality, consider whether the INP improvement is worth the development cost. A page with interactive maps, data visualizations, or real-time features will always have higher INP than a text-based blog post. Set realistic expectations. A map that responds in 300 milliseconds is acceptable. A button that responds in 300 milliseconds is not.
Google's thresholds are guidelines. Not hard rules. A page with Good INP isn't guaranteed to rank higher. A page with Poor INP isn't guaranteed to rank lower. The ranking impact is small. The user experience impact is what actually matters. Someone who can't click your buttons won't convert. That's the real cost.
For many websites, INP is often the most complex Core Web Vital to optimize because it depends heavily on JavaScript execution. The easy fixes help around the edges. Remove unnecessary scripts. Defer what you can. Optimize event handlers. These might get you from Poor to Needs Improvement. They might get you from Needs Improvement to Good if your problems are mostly third-party scripts.
Getting from Poor to Good usually requires developer work. Breaking up long tasks. Moving work to web workers. Restructuring how JavaScript loads and executes. These aren't plugin settings. They're code changes. If you don't have a developer, you may need one.
Start with the low-hanging fruit. Audit your third-party scripts. You probably have some you don't need. Every script you remove is JavaScript that never runs. The main thread is freer. Interactions feel faster. This alone fixes more INP problems than most people expect.
Then decide whether the remaining INP issues are worth the development cost. If your INP is Poor and your pages feel sluggish, yes, it's worth fixing. Users are leaving. They're just not telling you. If your INP is Needs Improvement and your pages feel responsive, the cost might outweigh the benefit.
INP matters because slow interactions frustrate users. A page that responds instantly feels professional. A page that lags feels broken. The ranking impact is small. The user experience impact is large. Users don't care about your JavaScript architecture. They care about whether the button works when they click it.
And if your INP is already under 200 milliseconds, congratulations. You've won. Go work on something else. Our how to improve LCP guide and how to fix CLS guide cover the other Core Web Vitals. There's always something else to optimize. But INP? If it's green, you've earned the right to move on.